Compute commitments
Source records, code and data for When Compute Commitments Become Claims.
Download P01 source and data ZIP ↗Read P01 and its methods →Indiconomics / evidence desk
Work with the figures behind the research. Choose a scope, inspect a disclosure, or step through a scenario based on a filed tariff. Every view leads back to its source and limits.
01 / Trade and production
Compare one of six overlapping export scopes across calendar years 2015–2022. Switch between current-price dollar values and a domestic-value share; the chart shows one scale at a time.
Domestic value added · current USD bn
| Calendar year | Domestic value added (current USD bn) |
|---|---|
| 2015 | 332.1 |
| 2016 | 332.0 |
| 2017 | 371.7 |
| 2018 | 399.9 |
| 2019 | 404.0 |
| 2020 | 399.4 |
| 2021 | 481.5 |
| 2022 | 543.8 |
Scopes overlap and must not be added. A change between shares is in percentage points. TiVA is model-based; current-price changes alone do not establish real production capability, productivity or a policy effect. Domestic origin does not establish corporate ownership or where profits are retained.
02 / AI infrastructure
Each company reported a net-income effect after lengthening the estimated useful life of specified equipment. Inspect the disclosure against that company’s own reported net income.
Company periods and equipment populations differ. Select a company to see its own disclosure.
The reported denominator includes the effect. The disclosed numerator is rounded.
This is a disclosed historical accounting effect. It does not measure AI profit or a share of earnings growth. The numerator is rounded, so the displayed 4.1% ratio should not be treated as greater precision.
03 / AI infrastructure
Choose one of 15 source capacity rows. These are assumed contract capacity scenarios for the post-ramp affiliated new-load capacity component, with an 85% ceiling.
Discrete source rows only. Selecting a row does not interpolate between capacities.
The dashed marker shows the 85% ceiling. Post-ramp affiliated new-load capacity component only. The selected row is an assumed contract scenario, not measured customer load, actual use, total billing demand or a forecast. Displayed MW and percent figures are rounded from the source row.
Source: AEP Ohio Schedule DCT, sheet 223-4, effective 28 August 2026. This is the frozen tariff material used for P01, not a current tariff feed. The P01 pack records the source link; it does not redistribute the original filing.
Reproduce the work
These frozen files accompany the published working papers. Read the methods and source notes before reusing a result.
Source records, code and data for When Compute Commitments Become Claims.
Download P01 source and data ZIP ↗Read P01 and its methods →Replication materials for When the export mix changes the story.
Download P02 replication ZIP ↗Read P02 and its methods →The Observatory / AI infrastructure
Three places. Different instruments. Open a case to see what the documents establish.
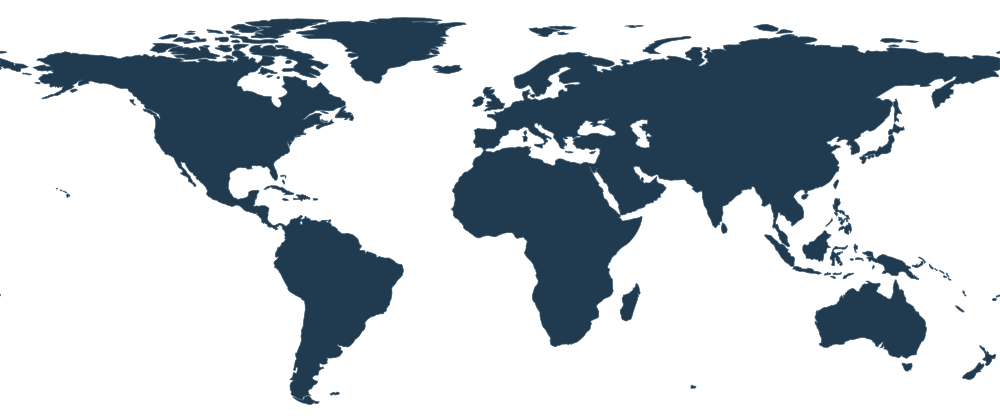
Markers identify research geographies, not individual facilities. Colour indicates the selected case.
Map: Natural Earth ↗Electricity Demand, Customer Credits and Creditor Timing.
Open the working paperSigned tariff capacity / capacity in study requests
Commitments as of 12 February 2026
AEP Ohio reported that part of its studied data-centre demand had progressed to signed tariff commitments. That is a different milestone from requesting a connection.
This measures a change in commitment status. It does not measure delivered electricity, operating servers or utilisation. The studied cohort is not all demand in Ohio.
These are different ratios answering different questions. They are not a ranking, a common loss measure, or a live market feed.
Return to the journalRead the research
29 published reading pages across the programme. The cards follow the current published catalogue.
AI infrastructure
Customer-funded construction, fee credits and the value of timing.
Read article →AI infrastructure
Equipment-life revisions, reported earnings and the limits of extrapolation.
Read article →AI infrastructure
Norwegian financing and Andhra Pradesh incentives put different claims on public money.
Read article →AI infrastructure
Electricity demand, customer credits and creditor timing.
Read working paper →Trade and production
Separate the domestic value embodied in exports from its share of gross exports.
Read article →Industrial production
The same 56-aircraft order shows which production tasks crossed borders, and which dependencies did not
Read article →Trade and services
What remote delivery, foreign affiliates and embodied value each reveal about India
Read article →Strategic supply chains
What company disclosures reveal about the stages of rare-earth supply that are operating, contracted, planned or still awaiting a customer
Read article →Industrial policy
A reconstruction across 14 sectors separates money paid from factory activity, and shows why neither establishes the price of creating a job.
Read article →Trade and climate
Cleaner production can lower a carbon charge. Contracts help determine who receives the saving, and whether proving it pays.
Read article →Trade and production
Domestic services in manufacturing exports across four selected economies, 2015–2022
Read working paper →Industrial policy and trade
What company accounts, tariff studies and carbon-border contracts establish
Read working paper →Research
India's semiconductor subsidy is quoted as a single number. Its controlling instruments use different cost bases and release support against eligible expenditure, with production obligations attached.
Read article →Research
Three rare-earth arrangements quote $110/kg. Their terms say more than the shared number about risk, while inventory and diversified supply depend on how long a disruption lasts.
Read article →Research
In 2024, a carrier’s late recovery left annual operating profit flat while Suez’s receipts collapsed. The accounts reveal different outcomes, not a complete allocation of the disruption’s cost.
Read article →Research
What two 2022 balance sheets reveal about goods in transit, supplier credit and customer collection
Read article →Research
A March 2023 industrial invoice separates a charge for capacity from charges that depend on the hour of use.
Read article →Research
A worked British connection example shows why the cost of building a link and the amount charged to its first applicant are different questions.
Read article →Research
What India’s and Japan’s published bonds reveal about April 2026–March 2027
Read article →Research
The different clocks of a rate rise.
Read article →Research
India’s 2022–23 and 2023–24 household surveys against one national-accounts vintage
Read article →Research
Two audited Indian company accounts show why the currency of a balance sheet, the date of a payment and the cash available to meet it must be read together.
Read article →Research
Eight observations of one private-credit holding show why a maturity extension, accrued income and an estimated recovery value must be read separately.
Read article →Research
USDC can move between wallets. Turning it into bank dollars, and receiving income from the assets behind it, depends on a different set of relationships.
Read article →Research
Four US January snapshots, 2020–2026
Read article →Research
What two German information experiments can—and cannot—tell us about firms that hold back
Read article →Research
What experiments reveal—and leave unresolved—about the value of a qualification.
Read article →Research
An April 2025 England budget scenario shows why the share of a pay difference left after housing depends on how many earners share the bill.
Read article →Research
A dated comparison of India-bound transfer quotes from the United States, United Kingdom and United Arab Emirates.
Read article →