Research article
INDICONOMICS
A Subsidy per Job, or per Announcement?
A reconstruction across 14 sectors separates money paid from factory activity, and shows why neither establishes the price of creating a job.
India’s solar Production Linked Incentive (PLI) scheme reported 13,607 jobs and no incentive disbursements through December 2025. The advanced chemistry cell battery scheme reported another 1,118 jobs, also alongside zero disbursement. Both entries appear in the same parliamentary table.[1]
Dividing the payment column by the employment column produces zero in each case. It does not establish that these jobs were free, that the schemes created them, or that the promised incentives were irrelevant. A manufacturer can hire before making the sales that qualify for payment. The prospect of a later subsidy might influence that decision even when no money has yet arrived.
The table is more informative when read as a record of different stages. Across the table’s 14 sectors, large-scale electronics manufacturing and pharmaceuticals account for approximately three-quarters of reported incentive payments, against about a quarter of listed outlays. Elsewhere, zero payments coexist with evidence of factory capacity and employment. Battery manufacturing also has officially acknowledged implementation delays. There is no single story of either success or failure behind the aggregate.[1][2]
That distinction matters for the next industrial-policy decision. An eligible factory waiting for reimbursement, a new project still within its permitted construction period and a plant struggling to begin commercial production require different responses. A headline subsidy-per-job number can make those situations look interchangeable.
A budget is not a bill
In May 2023, the Cabinet approved IT Hardware PLI 2.0 with a six-year budgetary outlay of ₹17,000 crore and an expectation of 75,000 incremental direct jobs. The scheme covered products including laptops, tablets and servers. Dividing the budget by the employment expectation gives approximately ₹22.67 lakh per target job.[3]
The apparent price tag needs a narrower interpretation. The numerator is an announced budget spanning years; the denominator is an expected outcome. The calculation does not show how much the government has spent, how many additional people are working because of the scheme, or what each worker receives.
The December 2025 parliamentary table permits a different calculation. Its IT Hardware row lists ₹81 crore disbursed and 4,776 reported jobs. That is approximately ₹1.70 lakh of cumulative reported incentive disbursement per reported job in that published snapshot.[1]
This snapshot cannot serve as a like-for-like update of the ₹22.67 lakh figure. The earlier calculation uses a six-year budget and a job target for Hardware 2.0. The later row reports a dated administrative aggregate without separating the original hardware scheme from its successor or matching the recipients of payments to the firms reporting employment. The much smaller ratio cannot be read as a saving in the cost of job creation.
Nor can a newer number simply replace its denominator. An April 2026 parliamentary answer reports 5,039 direct jobs under Hardware 2.0 through February, followed by ₹82 crore disbursed under the plural “schemes” up to the answer’s date. Those are not an explicitly matched pair. A subsequent ministry summary reports 5,211 direct jobs under the hardware schemes through May, without a corresponding payment figure.[4][5]
Even employment needs a definition. Hardware 2.0’s guidelines cover domestic workers on the payroll, contractual workers and apprentices in production and related activities within the facility. An employment total is therefore not necessarily a count of permanent factory jobs. The public aggregates used here do not establish full-time equivalents or the employment that would have existed without support.[6]
Where the money has gone
The December table lists ₹1,91,049 crore of allocated outlay across the 14 sectors and ₹28,748 crore of cumulative incentive disbursements. Reported payments amount to about 15.05% of that listed outlay. The denominator is the table’s scheme allocation, not an annual expenditure budget or an amount already due.[1]
The distribution is more informative than the overall percentage. Large-scale electronics accounts for ₹15,473 crore of reported disbursement and pharmaceuticals for ₹6,022 crore. Together, these two largest payment categories received ₹21,495 crore: 74.77% of all reported disbursements. Their combined listed outlay is ₹49,193 crore, or 25.75% of the total.
This concentration describes the fiscal record at one date. It does not establish that these sectors have been favoured in administering claims or offer the best return on public money. Schemes began at different times, have different horizons and pay against different conditions. A mature programme and a new factory awaiting qualifying production should not be judged against an identical payment clock.
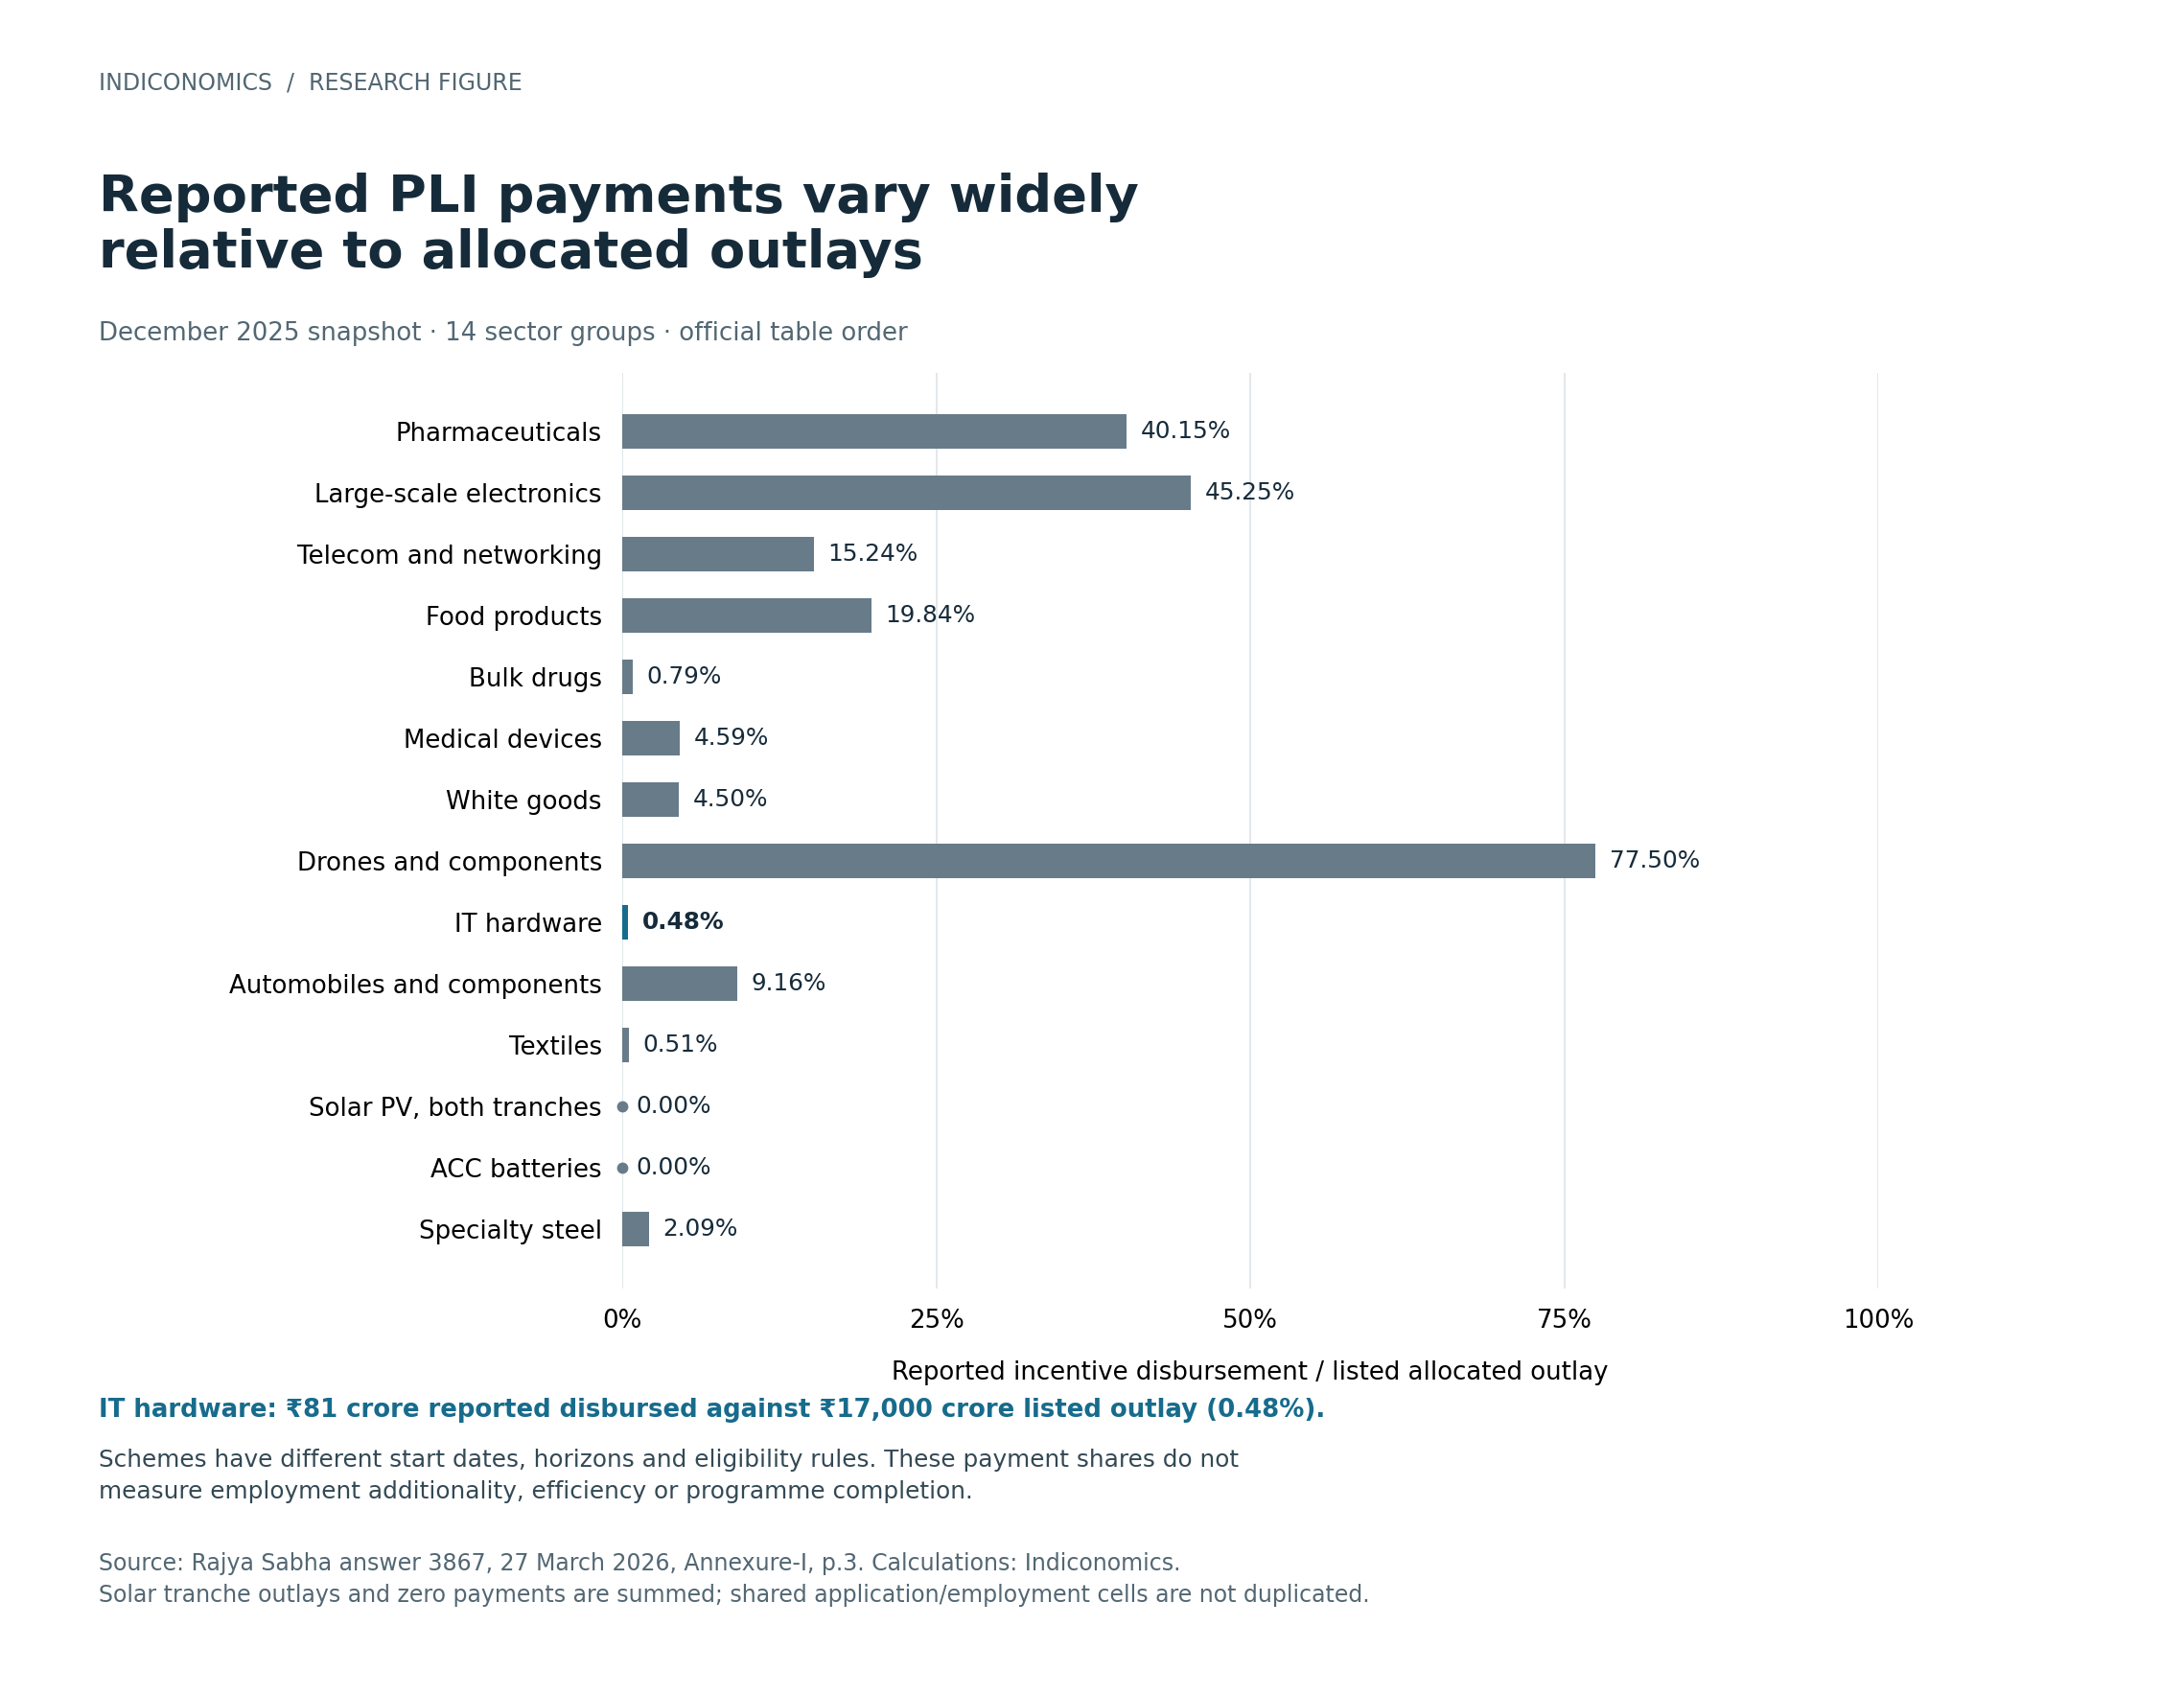
Figure 1. Cumulative payments divided by the allocated outlay listed in the parliamentary table. The chart follows the source’s sector order, not an efficiency ranking. Solar’s two tranche outlays are combined; their shared employment and application entries are counted once in the underlying data. Source: Rajya Sabha answer 3867, 27 March 2026, Annexure-I.
For example, the drones scheme’s ₹93 crore of reported payments equals 77.50% of its ₹120 crore listed outlay. Hardware’s ₹81 crore equals 0.48% of ₹17,000 crore. These payment shares differ sharply, but cannot establish which programme creates jobs more efficiently. No common maturity adjustment or counterfactual employment comparison has been made.
A single aggregate payment percentage conceals sharply different stages of expenditure. Some sectors dominate cash already paid; substantial allocations elsewhere have translated into little or no reported payment. Whether the next rupee should support expansion, clear an eligible claim or address a production bottleneck cannot be decided from that aggregate.
Zero payments, different explanations
Solar provides a concrete reason to resist equating no payment with no activity. In its December 2025 year-end review, the renewable-energy ministry said PLI beneficiaries had installed around 11 GW of module manufacturing capacity and 5 GW of cell manufacturing capacity during the year.[7] These are reported additions to manufacturing capacity, not measurements of output or proof that incentive claims had qualified. They nevertheless describe physical investment alongside the zero-payment entry.
The original rules for the first and second solar tranches explain the distinction. Incentives depend on qualifying module sales, performance and domestic value addition, with documentation and verification. Claims are annual. A factory’s recruitment or equipment installation does not by itself make an incentive payable; failure to meet required integration, capacity or performance conditions can prevent payment.[8][9]
Solar payment and employment records can consequently move at different times even when a project is progressing. But the rules alone cannot prove that a particular unpaid applicant has met its conditions and is merely waiting for administration. That requires the applicant’s qualifying sales, claim and verification record. The reconstruction here does not contain those records.
Battery manufacturing exposes a limit to the payment-lag explanation. A February 2026 heavy-industries ministry response listed 40 GWh of awarded capacity across four beneficiary firms and 1,118 direct jobs, the same employment total recorded in the December parliamentary table. It also described Ola Cell Technologies’ installed capacity as 1 GWh, with pilot production having begun in March 2024. At the time of the February response, the company was still working towards stable full-scale commercial production.[2]
The ministry explicitly identified delays in the scheme’s progress, citing technology availability, skills, imported equipment and upstream components. This is evidence of implementation difficulties, not simply an inference drawn from a zero in the payment table. Awarded capacity, installed capacity and stable commercial production were plainly different achievements.
There is also a consequential difference within the battery programme. A separate February response identifies 1 July 2025 as the appointed date for Reliance New Energy Battery Ltd’s later-round, 10 GWh project. The first two years of its seven-year period are for gestation.[10] It cannot be assessed as though it began on the same date as the earlier beneficiaries. Nor should its company name be conflated with the separately listed Reliance New Energy Battery Storage Ltd.
The original battery notification links disbursement to actual sales and domestic value addition, with quarterly payments. Like the solar rules, it supplies a mechanism linking production to eligibility.[11] Unlike the status report, it does not establish which firms have experienced delays in practice. Reading the two together supports a qualified finding: the sector contains actual implementation difficulties and different project schedules, while the available records do not allocate zero disbursement between failure to qualify, claims processing and other causes.
These concerns are not new to PLI research. IEEFA and JMK Research’s December 2025 solar assessment already examined implementation, commissioning and payment risks.[12] This reconstruction adds a dated comparison across the official fiscal table and separates those general explanations from the particular operational evidence.
What would establish the cost of an additional job?
PLI has objectives beyond employment, including scale, exports and domestic manufacturing capability. The Cabinet’s hardware announcement itself set production and investment expectations alongside jobs.[3] A programme could have valuable effects outside the recipient’s payroll, or pay for expansion that would have happened anyway. Neither possibility is resolved by counting approved applications.
For a fiscal cost per additional job, the employment denominator would have to exclude jobs that would have existed without the incentive. That requires a defensible comparison with an untreated outcome, and attention to whether activity was created, moved between firms or relocated from elsewhere. The spending numerator would need a compatible population and period. A cumulative payment divided by a single reported employment count also does not price a job maintained for a defined number of years.
Before that causal evaluation, there is a more immediately answerable administrative question. For each project, what capacity was promised, what commissioning date applies, what has begun operating, and what qualifying sales have been verified? Which claims were submitted, approved, queried or paid? Employment could then be reported on a defined basis for the same beneficiaries and reporting periods. Such a record would separate a factory awaiting reimbursement from a project that has not reached the payment threshold.
The distinction changes the policy response. If verified claims remain unpaid, the problem is a payment delay that can burden a manufacturer’s cash flow. If a project has missed an applicable production milestone, faster reimbursement cannot substitute for the missing capability. If production and jobs grow but would have grown without support, the expenditure may have bought less additional activity than the programme’s headline suggests. These are tests to apply, not outcomes established for every beneficiary here.
The next useful PLI headline would therefore identify what moved from promised capacity to operating capacity, and from eligible claims to money paid. Payments per reported job can be calculated. Establishing the cost of creating a job requires evidence the ratio does not contain.
References and notes
[1] Ministry of Commerce and Industry, Rajya Sabha answer 3867, 27 March 2026, pp.1–3, particularly Annexure-I, p.3. Calculations use the published December 2025 table. This is a historical audit of that snapshot, with operational commentary from February 2026 and later hardware disclosures through May 2026; it is not a September 2026 update of scheme performance. Historical sources were rechecked on 28 September 2026 (India time).
[2] Ministry of Heavy Industries, PLI scheme for advanced chemistry cell battery storage, 10 February 2026, beneficiary table and following implementation discussion. The 31 December 2025 footnote attaches to the investment column; the employment total agrees with the separate December parliamentary table without establishing identical audited firm coverage. Operational commentary is from the February response.
[3] Cabinet, approval of IT Hardware PLI 2.0, 17 May 2023, salient features and expected outcomes.
[4] Ministry of Electronics and Information Technology, Lok Sabha answer 6072, 1 April 2026, IT Hardware 2.0 discussion, p.3.
[5] Ministry of Electronics and Information Technology, May 2026 achievements summary, p.1.
[6] MeitY, IT Hardware PLI 2.0 guidelines, §2.11; see also §§16.3 and19 for approval and claims processing.
[7] Ministry of New and Renewable Energy, year-end review, 29 December 2025, Solar PV Manufacturing, capacity addition under PLI.
[8] MNRE, Solar PLI guidelines, 28 April 2021, §§3.5–3.11, pp.6–8. Original scheme conditions; not a complete record of later applicant-specific changes.
[9] MNRE, Solar PLI Tranche II guidelines, 30 September 2022, §§5.2,6,7 and9.1, pp.7–12.
[10] Ministry of Heavy Industries, later-round ACC agreement and timetable, 6 February 2026, paragraph2.
[11] Ministry of Heavy Industries, ACC notification S.O.2208(E), 9 June 2021, ACC English section, PDF pp.39–43; §§3.4–3.5,5.1–5.4 and8.3. The linked compilation also contains unrelated notifications.
[12] IEEFA and JMK Research, Assessing the effectiveness of India’s solar production-linked incentive scheme, December 2025. Used for the existing implementation argument, not as independently verified causal employment evidence.