Research article
INDICONOMICS
The Globalisation That Never Enters a Container
What remote delivery, foreign affiliates and embodied value each reveal about India
A container is a poor boundary for the modern trading economy. A machine leaving an Indian port can embody foreign software, finance, design and logistics. An Indian software company can serve a client abroad without either party travelling. The same company can establish an affiliate in another country and sell there, creating an international supply relationship that does not appear as an export from an Indian resident.
All three are forms of economic integration. They are not pieces of one missing total. One measure records how a service is delivered. Another records supply through an overseas establishment. A third attributes the value inside an exported good to the industries and economies that produced it. Adding them would mix transactions with production-chain estimates and count some activity twice.
Kept separate, the measures show an Indian asymmetry. Remote cross-border delivery dominates India's outward services mix far more than it does the world's. Yet the foreign-services share inside India's manufactured exports has risen. Between 2015 and 2022, the foreign component rose by about 2.0 percentage points as a share of India's manufacturing exports, while the domestic component rose by 0.9 points. The comparison is descriptive, and its size depends on the starting year. Its value lies in showing how the route to market and the origin of value can point in different directions.
The services inside the goods account
A manufactured export contains more than factory-floor work. Upstream services can include research, software, telecommunications, finance, wholesale distribution and transport. The OECD's inter-country input-output system traces the value added by these service industries through production networks and attributes it to the manufactured exports that embody it.[1]
In 2015, services value added represented 23.8% of India's manufacturing gross exports: 15.4% came from Indian service industries and 8.4% from foreign service industries. By 2022, the total was 26.7%, split between 16.3% domestic and 10.4% foreign. The OECD's published India note independently reports the rounded 2022 total and foreign shares.[2]
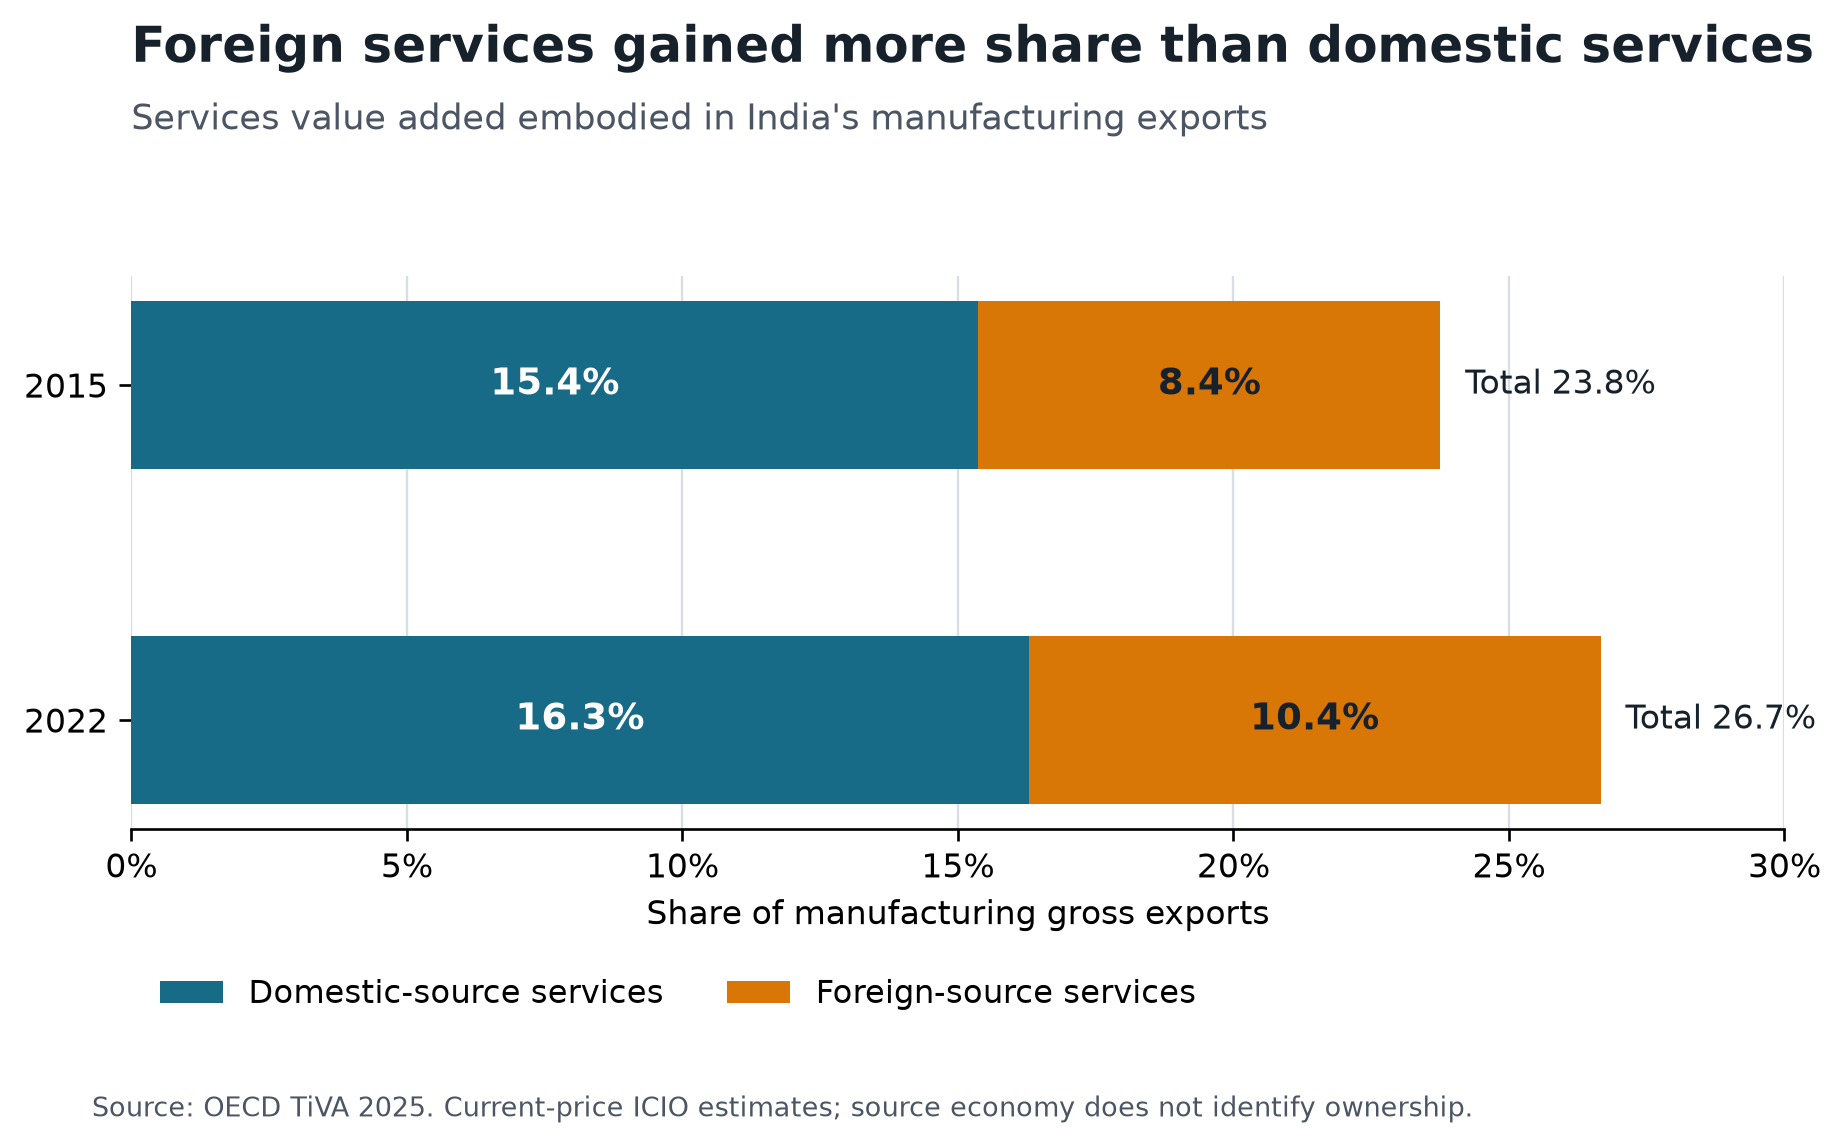
EXGR_SERV_DVA and EXGR_SERV_FVA; calculations from cached SDMX rows. Note: current-price ICIO estimates; source economy does not identify corporate ownership.Over those seven years, the total services share rose 2.9 percentage points. The 2.0-point foreign increase made up 68.7% of that arithmetic change; the 0.9-point domestic increase made up the rest. That fraction is a property of the selected window, not a structural parameter. Using 2010 as the starting year reduces the foreign fraction to 42.7%. From 2019 to 2022, the foreign share rose 1.2 points while the domestic share fell 1.5 points, so the total services share declined by 0.3 points.
The more durable finding is the direction of the foreign share. It was higher in 2022 than at every tested starting year (1995, 2005, 2010, 2015 and 2019), and it rose from 2015 in 13 of 16 non-overlapping manufacturing groups. Those 16 groups reconcile to the aggregate manufacturing denominator within source rounding. This breadth check weakens the claim that one broad industry alone produced the national movement. It cannot tell us whether firms changed suppliers, export product mixes shifted within each group, or relative prices changed.
Current-dollar levels give scale without resolving those explanations. The estimates for domestic services rose from $34.3 billion to $66.4 billion between 2015 and 2022; foreign services rose from $18.7 billion to $42.3 billion. Manufacturing gross exports rose from $223.4 billion to $407.7 billion. These nominal amounts combine quantities, prices, exchange rates and export composition. They are not measures of real growth or productivity.
The result also needs the right noun. “Foreign” identifies the economy in which the service value added originated. It does not identify the producer's nationality. A foreign-owned service business operating in India can create domestic value added; an Indian-owned affiliate operating abroad can create foreign value added. Nor is the 10.4% foreign share a separately invoiced import observed at customs. It is an input-output attribution within the value of exported goods.[1]
Calling that share “leakage” would assume that Indian suppliers could replace the same inputs at the same cost, quality and reliability while manufacturers sold the same exports. The data do not support that assumption. Foreign services may complement Indian production and help it compete. The estimates also inherit a modelling limitation: recent OECD input-output tables can extrapolate older supply-use structures using newer national accounts and trade constraints.[1] Firm- and product-level evidence would be needed to distinguish efficient specialization from a costly capability or resilience gap.
A service can cross a border, or the supplier can
The World Trade Organization separates four ways of supplying a foreign market. Mode 1 is cross-border supply: the service moves while supplier and customer remain in their economies. Mode 2 covers consumption abroad, such as tourism. Mode 3 is commercial presence through an affiliate or other establishment in the customer's economy. Mode 4 covers the temporary presence of people.[3]
In the WTO's experimental TiSMoS estimates for 2022, Mode 1 represented 73.6% of India's outward four-mode sum, against 34.7% for the world. Mode 3 represented 14.0% for India and 56.1% globally. Put another way, India's estimated Mode 3 supply was 0.19 times its Mode 1 supply; the world ratio was 1.62.[3]
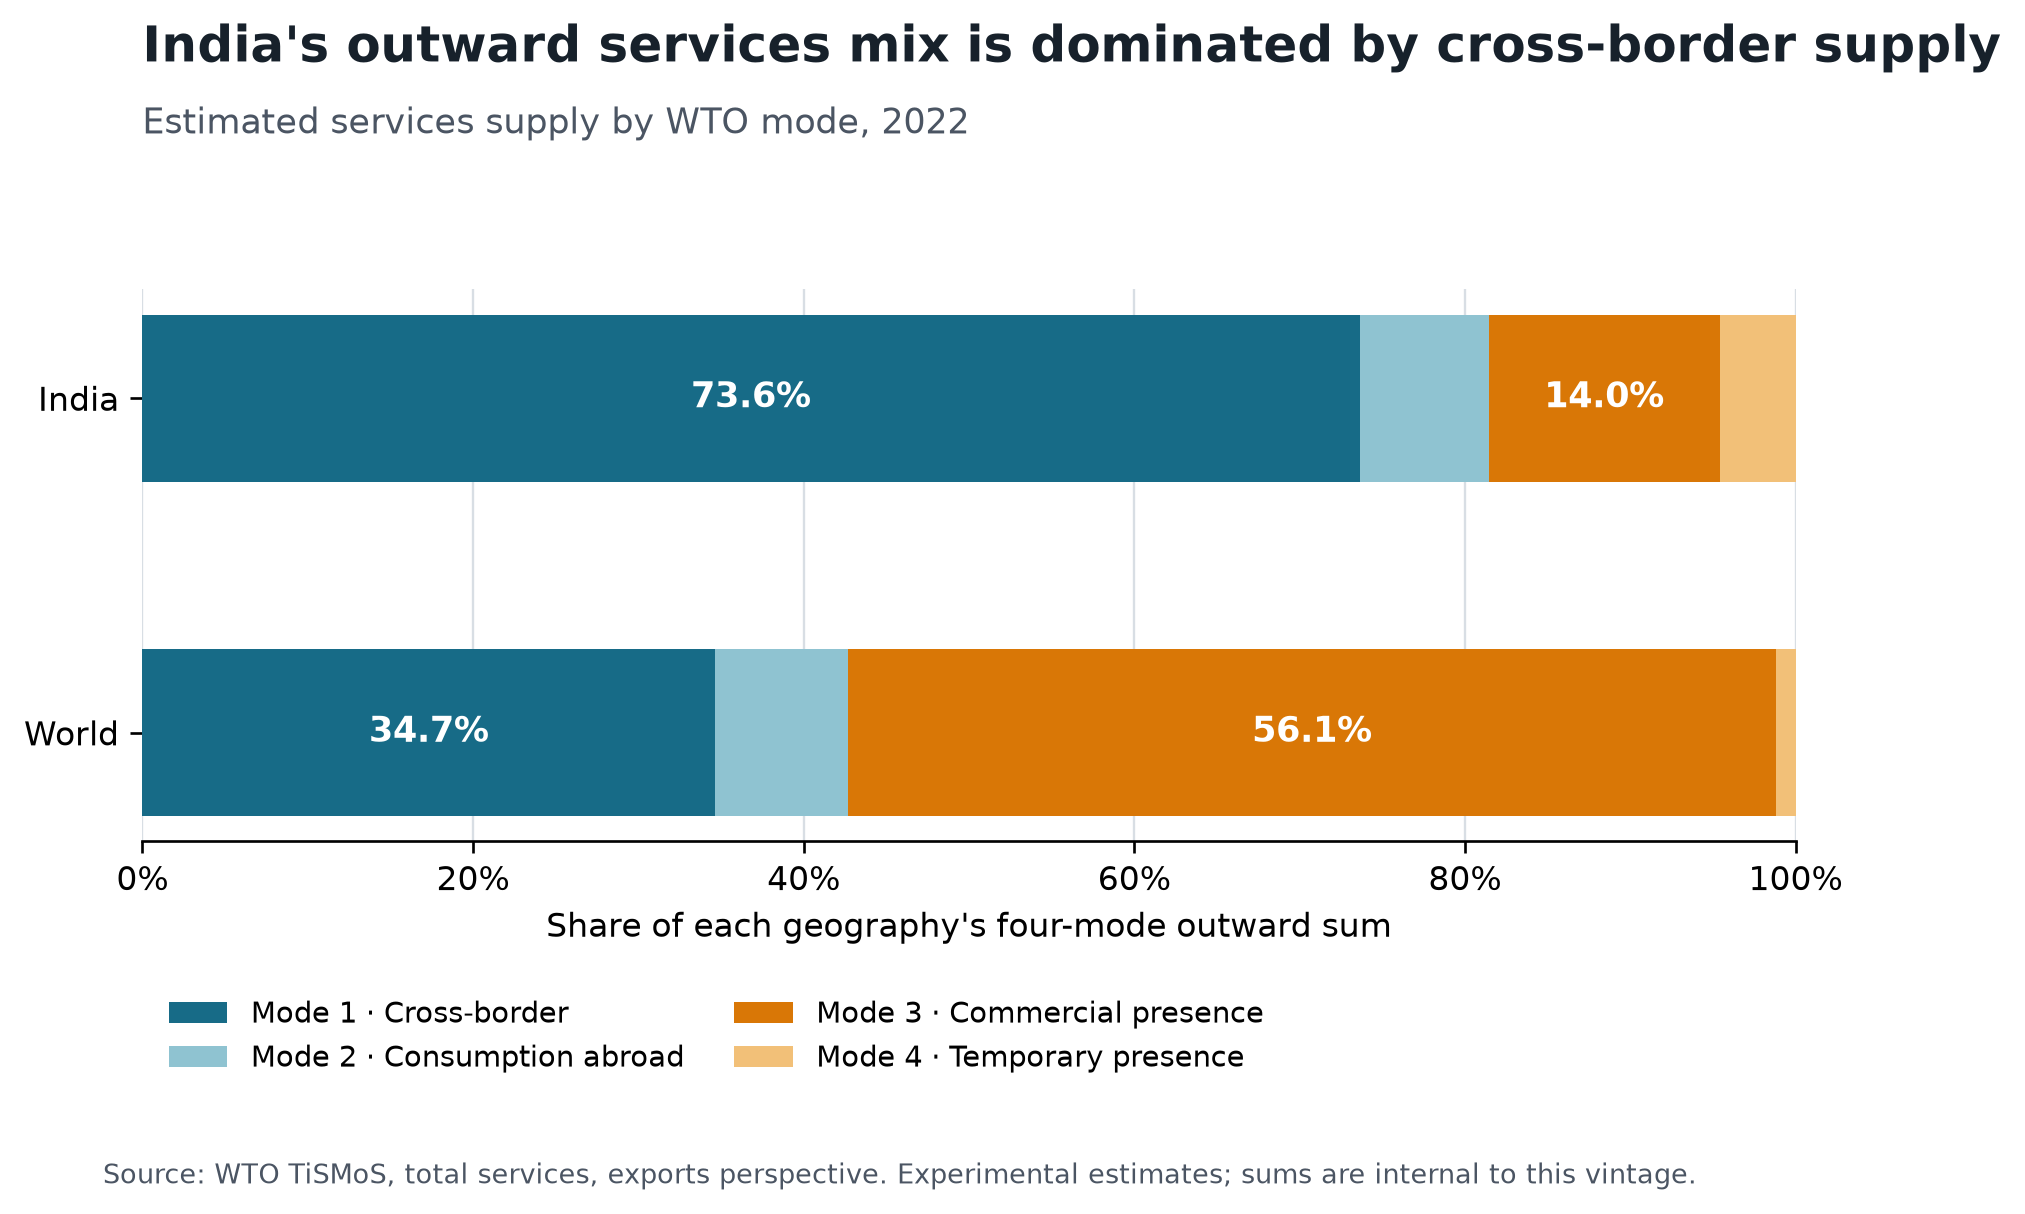
SOXSW), exports perspective. Note: experimental estimates built from balance-of-payments, foreign-affiliate and allocation data; percentages are comparable within this TiSMoS vintage and are not added to Figure 1 or WTO digital-delivery estimates.The Reserve Bank of India's narrower software survey points in the same direction. In FY2023–24, it reported $171.3 billion through Mode 1, or 83.5% of its four-mode survey total, and $14.5 billion of local software business through foreign affiliates of Indian companies, or 7.0%. The survey contacted 7,226 firms; 2,266 respondents represented nearly 89% of software-services exports, and exports of small non-respondents were estimated.[4] This is evidence about Indian software companies, not every service industry.
The strongest rival explanation is industry composition. Software and business services, prominent in India's exports, are unusually suited to remote delivery. Commercial presence matters more when regulation, licensing, customer trust, after-sales work or local knowledge require proximity. The aggregate comparison does not reveal whether Indian firms establish abroad less often than comparable foreign firms in the same service category. It therefore cannot identify a missing affiliate opportunity, much less the effect of a larger affiliate footprint on profits, employment or tax revenue in India.
Even so, affiliates cannot be ignored in a world account. A separate OECD estimation system put global Mode 3 services supply at about $8.8 trillion in 2023, compared with $6.9 trillion for Modes 1 and 4 combined. It also estimated $2.4 trillion of overlap between affiliate activity and cross-border trade, including services exported by a foreign affiliate.[5] That overlap is why affiliate supply cannot simply be added to balance-of-payments exports.
Digital delivery is large, but it is not the whole digital economy
The WTO estimates that India's digitally delivered services exports reached $219.3 billion in 2022 and $317.3 billion in 2025, in current dollars.[6] These are estimates of services delivered remotely over computer networks. They do not cover every service that could be delivered digitally, and they do not describe everything ordered online.
A product purchased through a website is digitally ordered even if a truck delivers it. A consulting report sent by email is digitally delivered even if the contract was negotiated offline. Ordering and delivery are separate, overlapping characteristics in the international statistical handbook; only services can be digitally delivered under its definition.[7]
Digital delivery also does not erase economic distance. Using early-2000s US internet-use data, Blum and Goldfarb found that a 1% increase in physical distance reduced visits to foreign websites for taste-dependent digital products by 3.25%, while the distance effect for software was not statistically significant.[8] That old US result is not an estimate of Indian trade. It supplies a useful counterexample: removing freight costs need not remove differences in taste, language, trust, regulation or market access.
The route to market therefore changes the relevant constraint. Cross-border delivery raises questions about data movement, payments, tax rules, connectivity and recognition of professional qualifications. Commercial presence raises questions about establishment, licensing, local compliance and the cost of operating abroad. Embodied services raise a different question again: where production-chain value originated, whether or not a service crossed the border as a separately observed transaction.
Three lenses, three empirical tests
The container metaphor fails in three places. A service can cross a border remotely and appear in trade statistics without a shipment. A supplier can establish abroad and serve customers locally, creating international supply beyond the usual resident-to-nonresident export boundary. A physical export can carry service value added generated elsewhere in its production chain.
For India, the measures reveal an asymmetry rather than an aggregate. Its outward services mix is heavily weighted towards cross-border delivery, though aggregate industry composition may explain much of the contrast with the world. Separately, foreign-origin services took a larger share of the value of manufacturing exports in 2022 than in every tested earlier year. Neither result establishes that India should localize an input or build more affiliates.
Each instead defines the next test. Services strategy needs within-industry evidence on where local presence wins business that remote delivery cannot. Industrial strategy needs firm- and product-level evidence on which foreign services improve competitiveness and which create costly concentration. Trade policy needs to match the rule to the channel. Rules for remote delivery cannot substitute for market-access rules governing affiliates, and neither reveals where the value inside a manufactured export was created.
The globalisation that never enters a container is not one invisible flow waiting to be counted. It is a set of relationships made visible by using the right boundary for each question.
Sources and calculation notes
[1] OECD, Guide to OECD Trade in Value Added Indicators, 2025 edition, especially pp. 5, 9, 29–30 and 43; OECD TiVA 2025 SDMX extracts for India, manufacturing (C), World counterpart, 1995–2022, indicators EXGR_SERV_DVA, EXGR_SERV_FVA and EXGR, current-price USD millions or percent of gross exports as specified. Guide. Share-data query.
[2] OECD, Trade in Value Added: India, 1 June 2026, Figure 5 and accompanying text. Country note.
[3] WTO, Trade in Services by Mode of Supply (TiSMoS), 2005–2022 dataset and methodology, total services (SOXSW), outward perspective, India and World, 2022. The four-mode sums are internal to this experimental system; Mode 3 uses foreign-affiliate statistics and is adjusted towards output sold locally. Dataset. Methodology.
[4] Reserve Bank of India, Survey on Computer Software and Information Technology Enabled Services Exports: 2023–24, release of 18 October 2024, Tables 1 and 8 and survey coverage notes. Official release.
[5] OECD, Trends in Global Value Chains, July 2026, Chapter 4, pp. 27–28. The 2023 values are TiVA-MoS estimates; the rounded components are not used to construct a new total. Report.
[6] WTO, Digitally Delivered Services Trade Dataset, updated July 2026, India, total digitally delivered services (DDS), exports, Mode 1, current USD millions. Dataset.
[7] IMF, OECD, UNCTAD and WTO, Handbook on Measuring Digital Trade, second edition, 2023, executive summary and Chapter 2. Handbook.
[8] Bernardo S. Blum and Avi Goldfarb (2006), “Does the internet defy the law of gravity?”, Journal of International Economics 70(2), 384–405. Publisher page and DOI. The study uses US clickstream data and appears here as a mechanism countercase, not a current India estimate.