One rent, two pay packets
An April 2025 England budget scenario shows why the share of a pay difference left after housing depends on how many earners share the bill.
Take two adults looking for a two-bedroom home. Give one a full-time job paid at the median weekly rate for the workplace region. On a constructed monthly budget, the London household has about £972 left after income tax, employee National Insurance, rent and a hypothetical Band D council-tax bill. Give the same household the corresponding North West job instead and it has about £1,570 left. That is a £598 London shortfall before commuting.
Now give both adults a job at the same regional pay position. London has about £4,255 left on the same basis, against £4,154 in the North West: a £101 London lead. This is not a forecast for a couple considering a move. It is a controlled budget question: what happens when two assumed pay packets share one assumed housing bill? [1–4]
The London pay difference is counted for each assumed earner; the rent and council-tax differences are counted once for the home. That is why adding a second pay packet can reverse the sign. It leaves just £101 in this illustration, a narrow margin.
What the second pay packet changes
For a worker at the regional median, the London weekly gross-pay input is £958.20 and the North West input is £734.20. Multiplying each by 52 and dividing by 12 creates a constant-pay monthly salary scenario; it does not recover either worker's observed annual income. The gross difference is £970.67 a month per earner. Under England's 2025/26 standard income-tax and employee-NI rules, £271.79 of that difference is absorbed by the modelled extra deductions. The after-tax pay difference is £698.88 per earner. [1, 3]
The two-bedroom modelled rent is £2,146 a month in London and £818 in the North West, a £1,328 difference. The constructed regional Band D council-tax benchmark is £31.05 a month lower in London. Put the pieces together, and one London earner's £698.88 after-tax pay difference falls £598.07 short of the extra housing bill, after the council-tax offset. For two earners, the pay difference doubles while the specified housing bill does not. [2, 4]
Scroll the table sideways to read all columns.
| London minus North West, two-bedroom scenario | One earner | Two earners |
|---|---|---|
| Gross pay, £/month | +£970.67 | +£1,941.33 |
| Extra income tax and employee NI, £/month | −£271.79 | −£543.57 |
| Extra rent, £/month | −£1,328.00 | −£1,328.00 |
| Council-tax difference, £/month | +£31.05 | +£31.05 |
| Remainder difference before commuting, £/month | −£598.07 | +£100.81 |
Illustrative two-adult household, April 2025 pay and rent inputs, 2025/26 tax rules. Each earner is assigned the regional median full-time workplace-job rate. Components are independently rounded; adding displayed rows can differ by a penny. The council-tax figure is a hypothetical Band D benchmark.
Hypothetical two-adult household; April 2025 workplace-job pay and PIPR modelled rental-stock inputs; England 2025/26 income tax and employee NI; hypothetical Band D council tax; PIPR release vintage 16 September 2026; £ per month; remainder after specified tax, NI, rent and council tax, before commuting. Sources: ONS ASHE Table 7 (2025 provisional), ONS PIPR (16 September 2026), HMRC 2025/26, MHCLG 2025/26; Indiconomics scenario calculation.
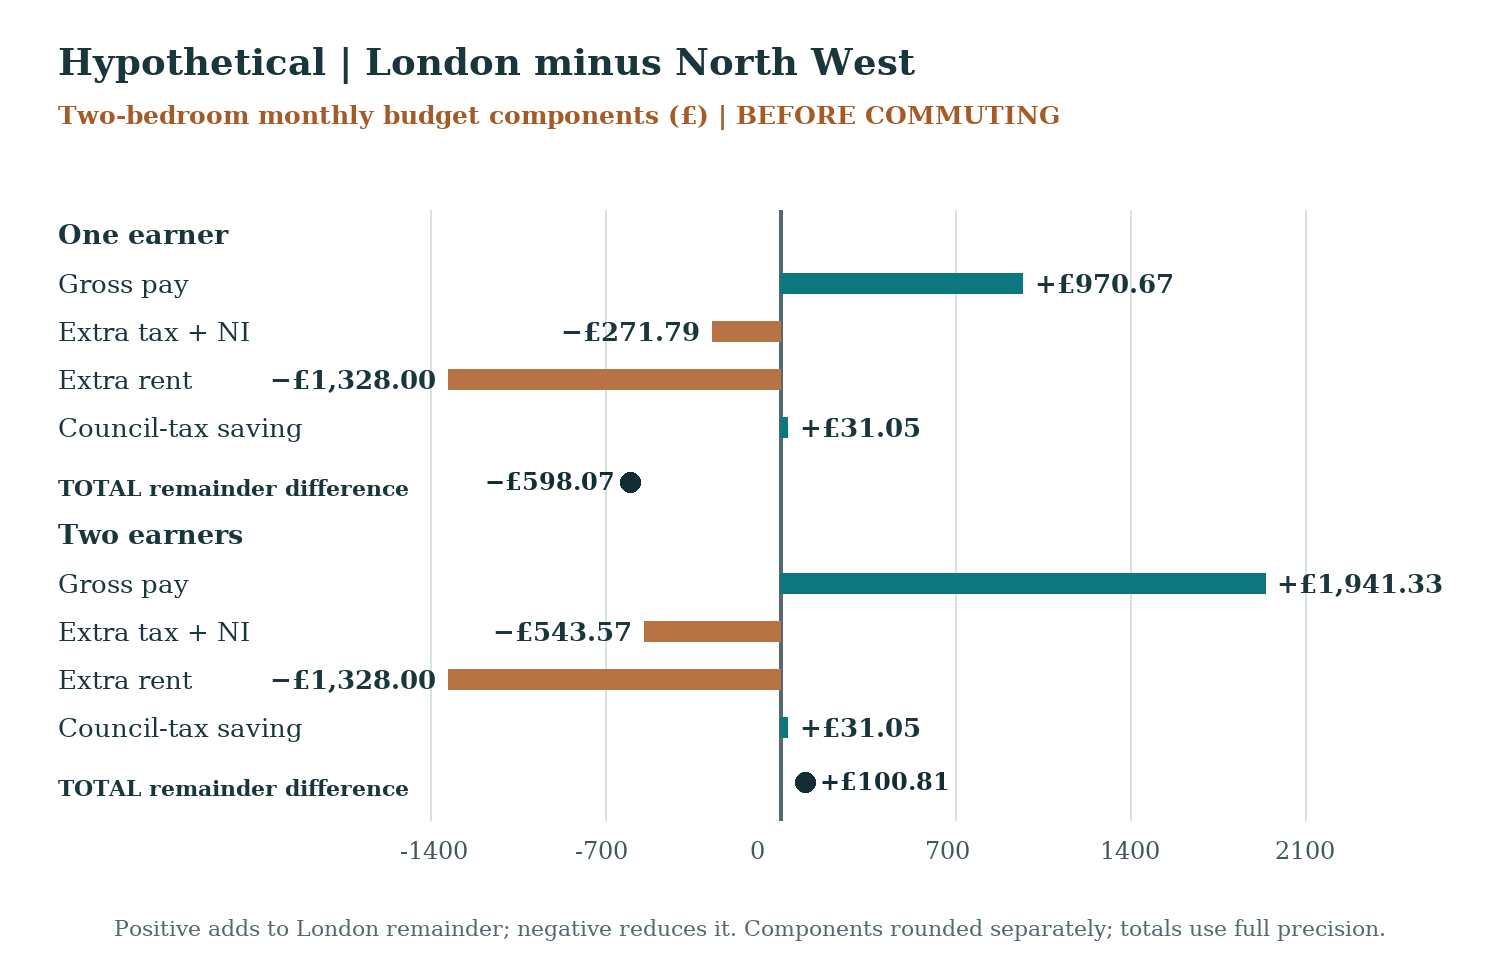
Scroll the chart sideways to read every label.
That £100.81 is only about 5.2% of the constructed £1,941.33 gross pay difference for two earners. A £100.81 increase in London's relative monthly rent would erase it. So would £100.81 of extra London costs omitted from the budget. Neither amount is a forecast.
Eight regions, two pay positions
The North West illustrates the mechanism; the full comparison tests whether its pattern is peculiar. With two bedrooms and median pay inputs, London trails each of the other eight English regions with one earner and leads each with two. The lead varies from about £101 against the North West to £322 against the South West. The final column assigns both earners the 25th-percentile weekly-pay input. [5]
Scroll the table sideways to read all columns.
| Region compared with London | Median: one earner | Median: two earners | 25th percentile: two earners |
|---|---|---|---|
| North East | −£603 | +£261 | −£517 |
| North West | −£598 | +£101 | −£501 |
| Yorkshire and The Humber | −£618 | +£162 | −£532 |
| East Midlands | −£537 | +£257 | −£474 |
| West Midlands | −£580 | +£130 | −£499 |
| East of England | −£434 | +£164 | −£368 |
| South East | −£323 | +£246 | −£267 |
| South West | −£394 | +£322 | −£361 |
London minus each region's monthly remainder after modelled income tax, employee NI, two-bedroom rent and hypothetical Band D council tax, before commuting; £/month rounded to the nearest pound. Two adults throughout. April 2025 earnings and rent inputs; 2025/26 tax rules; September 2026 rent-data vintage. These are linked scenario comparisons, not eight independent statistical tests. The full one-bedroom, two-bedroom and 75th-percentile rows are retained in the data supplement.
Hypothetical two-adult household; April 2025 workplace-job pay and PIPR modelled rental-stock inputs; England 2025/26 income tax and employee NI; hypothetical Band D council tax; PIPR release vintage 16 September 2026; £ per month; remainder after specified tax, NI, rent and council tax, before commuting. Sources: ONS ASHE Table 7 (2025 provisional), ONS PIPR (16 September 2026), HMRC 2025/26, MHCLG 2025/26; Indiconomics scenario calculation.
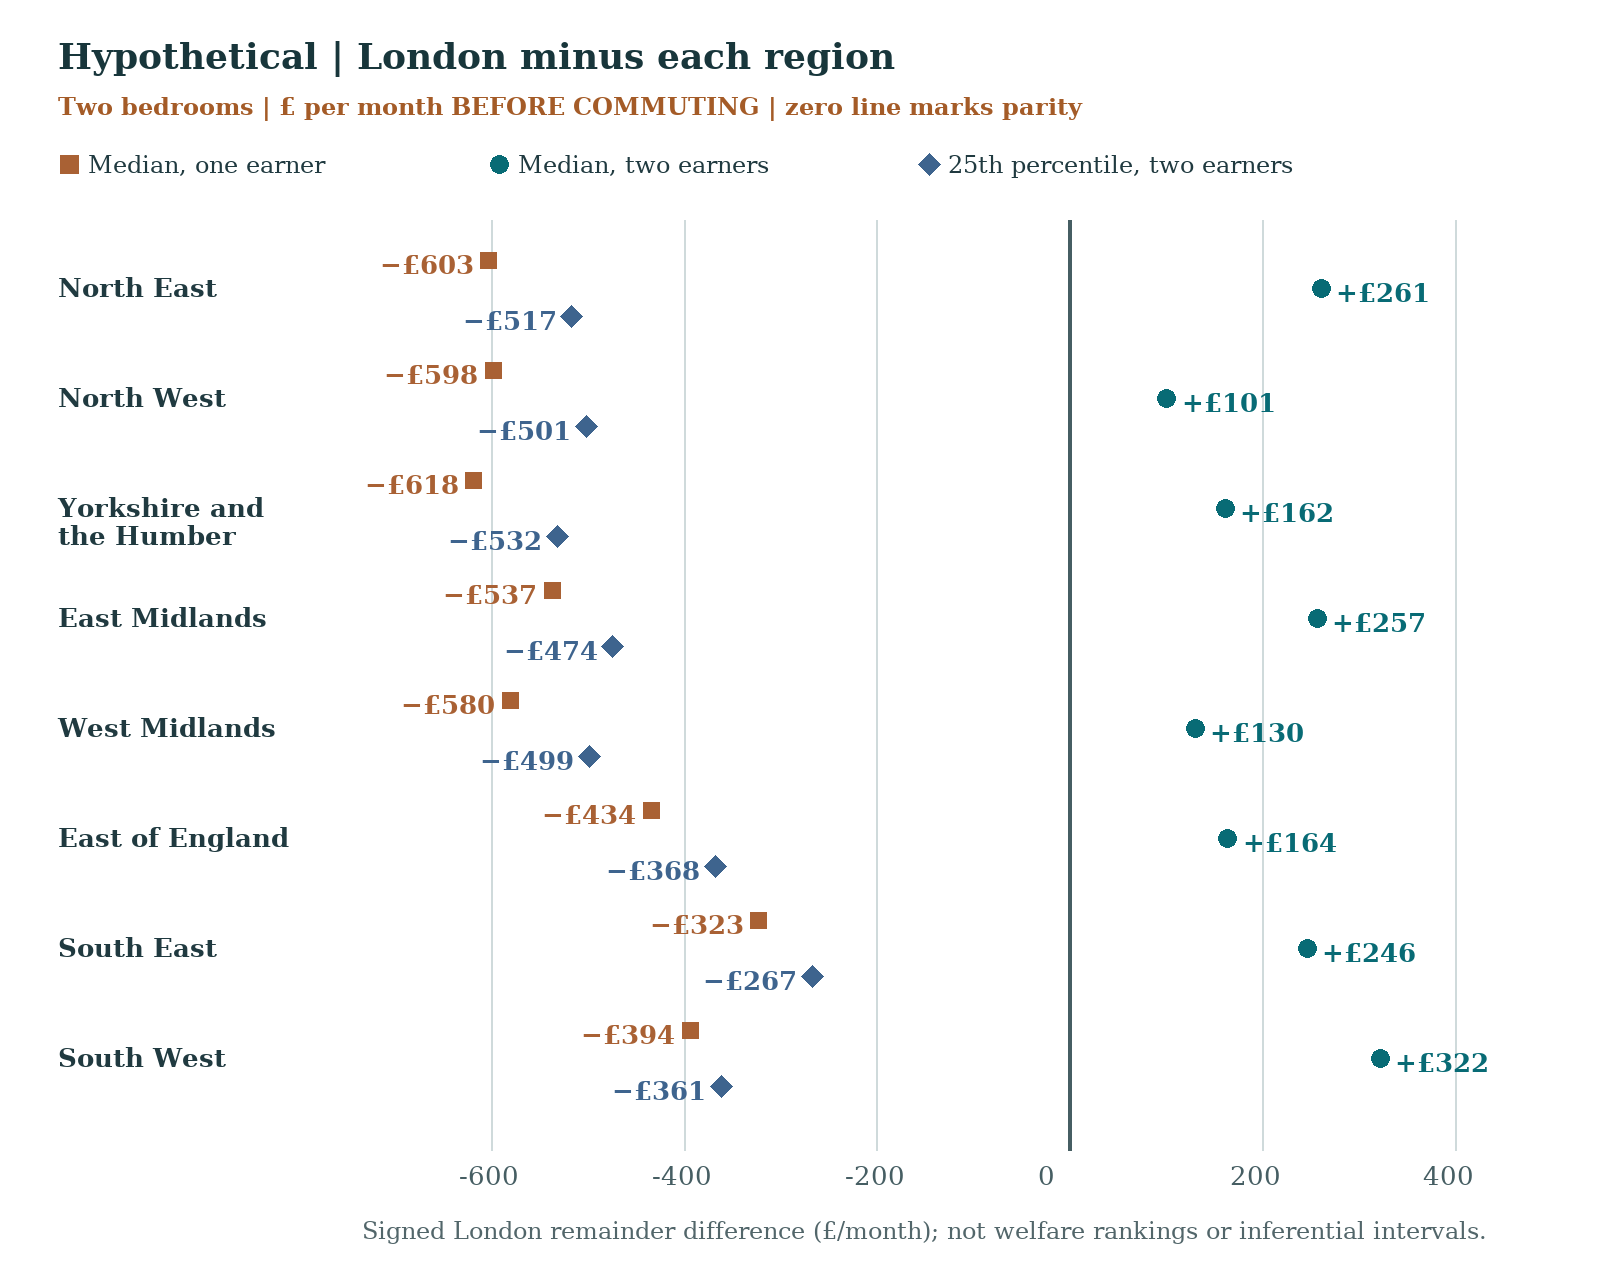
Scroll the chart sideways to read every label. The preceding table gives every plotted value.
For a two-bedroom home, the 25th-percentile input leaves London behind every comparator even with two earners: about £501 a month behind the North West. The same negative pattern holds with one bedroom and with either earner count. At the median, the one-bedroom signs still flip across all eight regions when a second earner is added, with two-earner London leads from about £382 to £588. The lower-pay countercase matters because sharing the rent does not guarantee a positive balance: the after-tax pay gap still has to cover the regional housing gap at the assumed pay position. [5]
The bedroom comparison also shows why “the rent” needs a definition. A two-bedroom London rent is £458 higher than its one-bedroom figure in these regional inputs; the North West increment is £167. Switching bedroom count therefore widens London's relative housing cost by £291 in that comparison. Bedroom count holds one useful feature constant, but it does not make the properties identical in floor area, neighbourhood, condition or access to work.
The 75th-percentile cases add a further boundary. With two earners, London's calculated remainder exceeds all eight comparators for either bedroom count. With one earner and two bedrooms it remains lower against every comparator. With one earner and one bedroom the signs are mixed. Changing the pay position or bedroom count changes the balance of wage and rent differences; the median two-earner reversal is no ranking of places. The same percentile still does not mean that a particular worker could obtain either job. [5]
A small margin meets the commute
The main budget stops before commuting. In the median, two-earner, two-bedroom North West comparison, the £100.81 London lead would vanish if the sum of the two workers' extra London commuting costs were £100.81 a month. If the extra cost were equal for both, the break-even amount would be £50.41 per worker per month. This is an accounting threshold, not a measured train fare, average travel bill or estimate of the time spent travelling. A household with one unusually long commute and one short commute should add its actual differences rather than split them equally.
A negative London-minus-comparator difference instead requires a London commuting saving or another monetary offset to close the cash gap. An amenity may be valuable without supplying that offset. The threshold never implies a literal negative fare. The model has no actual travel route: it cannot tell whether either worker would cross a regional border, work remotely or change travel mode. It assumes residence and employment in the named region, while pay is classified by workplace and includes commuters from elsewhere. Those job pay figures are not measured resident incomes. [1]
The £101 positive case is also sensitive to the pay estimates. An illustrative stress lowers London's median weekly-pay input by twice its published coefficient of variation and raises the North West's by twice its own, leaving the other assumptions fixed. The two-earner difference becomes about −£11. Reversing those changes gives about +£213. These deliberately opposing adjustments are not a joint confidence interval, probabilities or a test that the London sign is statistically established. They omit covariance, rent uncertainty and the far larger question of which people get which jobs. [6]
What the comparison can tell a household
The wage and rent relationship itself is not new. Overman and Xu's 2024 study examines how rents offset estimated area wage effects across travel-to-work areas, accounting for individual characteristics. Their Figure 22 uses a different period and geography, and a wage measure unlike the raw regional pay percentiles used here. This article neither updates their estimate nor turns a regional pay difference into a same-worker wage premium. Its smaller contribution is to show, in one dated and reproducible cash account, how a shared housing bill interacts with one or two assumed pay packets and a commuting break-even condition. [7]
The pay figures are from April 2025 full-time employee jobs on adult rates whose survey-period pay was unaffected by absence. They exclude self-employment. A London job at the median and a North West job at the median can require different skills, hours, occupations and experience; the same percentile does not identify the same worker. Assigning both adults that percentile is an assumption, not an observation of a couple's joint earnings. Nor is adding a second full-time earner free: it adds work and may alter childcare, care for relatives, leisure and travel. Those changes matter to a decision even when they do not appear in this cash account. [1]
The rent inputs also have a narrower meaning than a property search. They are April 2025 modelled rental-stock price levels, taken from the ONS release vintage of 16 September 2026. They combine new and existing tenancies and are constructed using weighted geometric averages, with index growth applied. They are neither median rents nor today's asking prices. A household seeking a particular home could face a different rent; the regional series does not pair an actual property with an actual job. [2, 8]
The council-tax entry is similarly a benchmark. We weighted billing authorities' whole-area Band D rates by their Band D-equivalent tax bases to construct a regional rate, then assumed two adults liable for the full bill. A one- or two-bedroom rental is not necessarily Band D, and the rates are not the observed bills of homes behind the rent series. The wage calculation uses a constant 52-week salary and annualised tax and employee-NI schedules. It excludes pension contributions, student loans, benefit entitlements, reliefs and payroll-period rounding, among other items. [3, 4]
For a real decision, the useful test is to replace the scenario inputs. Start with two actual job offers, calculate each worker's take-home pay under the household's circumstances, price a home the household could rent in each place and obtain its council-tax band. Then subtract each person's likely monetary commuting costs, moving costs and any change in care costs, putting one-off and recurring amounts on a consistent time basis. Compare the total incremental cash costs with the after-tax pay difference. Assess commuting time separately alongside job risk, future prospects, housing quality and amenities, unless the household assigns an explicit pound value to them.
The arithmetic turns when a second median-input pay packet shares the two-bedroom bill. A real household's choice turns on whether it can obtain two suitable jobs and a comparable home together, then keep a cash advantage after travel and care costs. Regional pay and rent tables contain no such pairing. That is the observation needed before a £101 scenario remainder can become advice.
Source and calculation notes: Methods, references, scenario data. Evidence checked to 30 September 2026 UTC.
Methods and assumptions
Source cutoff: 30 September 2026 UTC. Original extraction and independent calculation records are retained separately in the original private research workspace. The original extraction produced four generated CSVs; an older methods count of five was a clerical error.
Assumption box
- Two adults live and work in the named English region. One or both hold full-time employee jobs at the same specified regional weekly-pay percentile (25th, median or 75th). This is a scenario, not an observed couple or a relocation estimate.
- Weekly workplace-job pay for April 2025 is multiplied by 52 to construct a constant-pay annual salary. This is not observed annual pay. ONS ASHE Table 7 (2025 provisional) covers employees on adult rates whose survey-period pay was unaffected by absence; self-employment is excluded.
- The dwelling has one or two bedrooms, held fixed within comparisons. The rent input is the ONS PIPR April 2025 monthly modelled stock level in the 16 September 2026 release vintage. It combines new and existing tenancies and is not a median, asking quote or matched property.
- England 2025/26 standard personal allowance and income-tax schedule are applied to each assumed salary. Employee National Insurance uses annualised category A thresholds and rates. No pension contribution, student loan, benefits, marriage-allowance transfer, other relief or payroll-period rounding is included.
- Both adults count for council tax. A regional hypothetical Band D bill is constructed by weighting 296 billing authorities' whole-area Band D rates, including major precepts, by their current Band D-equivalent tax bases. It is not the actual bill for a PIPR dwelling; no single-person discount is used.
- Commuting money and time, moving, care, job risk, amenities, career prospects and household welfare are outside the remainder. A second earner adds labour supplied.
Calculation
For region r, earners e in {1,2} and bedrooms b in {1,2}, monthly remainder before commuting is:
R(r,e,b) = e × [52 × weekly_pay(r) − annual_income_tax(r) − annual_employee_NI(r)] / 12 − monthly_rent(r,b) − annual_Band_D(r) / 12.
Each London comparison is R(London,e,b) − R(comparator,e,b). With equal additional London commuting cost c for each earner, parity occurs at c = difference/e. More generally, subtract the sum of the household's incremental commuting costs. Negative parity values mean London requires a saving. The sign is conditional arithmetic, not a statistical finding.
The calculation covers nine regions × three pay positions × two earner counts × two bedroom counts = 108 scenarios, then 96 London-to-region comparisons. ARTICLE.md's main table uses two bedrooms; VISUAL_DATA.csv retains every comparison and the unrounded source value. Printed article values round only after calculation. The two-earner London/North West two-bedroom median values are £970.67 monthly gross difference per earner, £271.79 extra income tax and NI per earner, £1,328 rent difference, £31.05 monthly council-tax saving, −£598.07 one-earner remainder difference and +£100.81 two-earner difference. The 5.2% ratio is £100.8143357 / £1,941.3333333. Equal per-earner commuting parity is £50.4071679, printed £50.41.
For the uncertainty illustration, the independently reviewed supplement perturbs London median weekly pay down 0.8% (twice its 0.4% reported CV) and North West up 1.4% (twice its 0.7% CV), yielding −£11.16, and reverses directions to yield +£212.79. This is an illustrative simultaneous input stress, not a joint confidence interval or significance test. The two assumed earners use one regional median estimate, not independent pay samples. Rent/model uncertainty and cross-region covariance are not covered.
Interpretation and reproduction
The population of jobs cannot be equated with resident households. Percentile matching does not match workers, skills, hours or homes. PIPR's within-region mix/index procedures do not equalise properties across regions. The larger cash remainder is not a welfare measure or moving recommendation. Overman and Xu (2024) study individual-controlled area wage effects against rents at travel-to-work-area level with 2012–19 inputs; their Figure 22 is contextual prior work, not an estimate transferable to these regional percentiles.
The 96-row comparison data and 108-row scenario-definition CSV accompany this reader export. The original extraction and review records remain separately in the original private research workspace.
References and source versions
[1] Office for National Statistics, Annual Survey of Hours and Earnings, Table 7, 2025 provisional, workplace geography. Table7.1a full-time weekly gross: median column D, 25th J, 75th O; Table7.1b median coefficient of variation, column D.
[2] Office for National Statistics, Price Index of Private Rents, UK monthly price statistics, release vintage 16 September 2026, Table 1 April 2025 one- and two-bedroom modelled rental-stock levels.
[3] HM Revenue & Customs, Rates and thresholds for employers 2025 to 2026, standard allowance, England income-tax bands, employee primary Class 1 category A rates and thresholds.
[4] Ministry of Housing, Communities and Local Government, Council tax levels set by local authorities in England 2025 to 2026, revised 22 April 2026, Data_Billing columns B/C/D/X/AL; Indiconomics Band D tax-base-weighted regional construction from 296 billing authorities.
[5] Indiconomics A28 frozen scenario calculations: all 96 London comparisons are in the reader data table and the accompanying VISUAL_DATA.csv; the 108 scenario definitions are in SCENARIO_DEFINITIONS.csv. These are hypothetical calculations, not observations of households.
[6] Indiconomics A28 calculation and sensitivity supplement: CV perturbation and rounding are described in the methods; original CV inputs are from ONS ASHE Table7.1b. This is illustrative stress, not a joint confidence interval or manuscript review.
[7] Henry G. Overman and Xiaowei Xu (2024), “Spatial disparities across labour markets”, Oxford Open Economics 3, Supplement 1, i585–i610, Figure 22 at i602; published PDF. Figure 22 uses 2012–19 travel-to-work-area inputs and individual-controlled area wage effects.
[8] Office for National Statistics, Price Index of Private Rents detailed methodology, price-level construction, weighting and monthly-dataset sections.
Full scenario comparison data
Download VISUAL_DATA.csv Download SCENARIO_DEFINITIONS.csv
The frozen VISUAL_DATA.csv provides all 96 London-minus-comparator combinations: eight regions × three pay positions × one/two earners × one/two bedrooms. The separate SCENARIO_DEFINITIONS.csv enumerates 108 scenario definitions across London and all eight comparators, without invented outcome values. Both CSVs accompany the HTML and private source pack. The signed values below are £ per month before commuting.
Scroll the table sideways to read all columns.
| Comparator | Pay position | Earners | Bedrooms | London minus comparator, £/month |
|---|---|---|---|---|
| North East | median | 1 | 1 | -275.80 |
| North East | median | 1 | 2 | -602.80 |
| North East | median | 2 | 1 | +588.44 |
| North East | median | 2 | 2 | +261.44 |
| North East | p25 | 1 | 1 | -664.87 |
| North East | p25 | 1 | 2 | -991.87 |
| North East | p25 | 2 | 1 | -189.69 |
| North East | p25 | 2 | 2 | -516.69 |
| North East | p75 | 1 | 1 | +91.99 |
| North East | p75 | 1 | 2 | -235.01 |
| North East | p75 | 2 | 1 | +1,324.01 |
| North East | p75 | 2 | 2 | +997.01 |
| North West | median | 1 | 1 | -307.07 |
| North West | median | 1 | 2 | -598.07 |
| North West | median | 2 | 1 | +391.81 |
| North West | median | 2 | 2 | +100.81 |
| North West | p25 | 1 | 1 | -608.15 |
| North West | p25 | 1 | 2 | -899.15 |
| North West | p25 | 2 | 1 | -210.35 |
| North West | p25 | 2 | 2 | -501.35 |
| North West | p75 | 1 | 1 | -45.85 |
| North West | p75 | 1 | 2 | -336.85 |
| North West | p75 | 2 | 1 | +914.24 |
| North West | p75 | 2 | 2 | +623.24 |
| Yorkshire and The Humber | median | 1 | 1 | -306.34 |
| Yorkshire and The Humber | median | 1 | 2 | -618.34 |
| Yorkshire and The Humber | median | 2 | 1 | +473.66 |
| Yorkshire and The Humber | median | 2 | 2 | +161.66 |
| Yorkshire and The Humber | p25 | 1 | 1 | -652.97 |
| Yorkshire and The Humber | p25 | 1 | 2 | -964.97 |
| Yorkshire and The Humber | p25 | 2 | 1 | -219.60 |
| Yorkshire and The Humber | p25 | 2 | 2 | -531.60 |
| Yorkshire and The Humber | p75 | 1 | 1 | +37.11 |
| Yorkshire and The Humber | p75 | 1 | 2 | -274.89 |
| Yorkshire and The Humber | p75 | 2 | 1 | +1,160.56 |
| Yorkshire and The Humber | p75 | 2 | 2 | +848.56 |
| East Midlands | median | 1 | 1 | -246.66 |
| East Midlands | median | 1 | 2 | -536.66 |
| East Midlands | median | 2 | 1 | +547.07 |
| East Midlands | median | 2 | 2 | +257.07 |
| East Midlands | p25 | 1 | 1 | -612.32 |
| East Midlands | p25 | 1 | 2 | -902.32 |
| East Midlands | p25 | 2 | 1 | -184.26 |
| East Midlands | p25 | 2 | 2 | -474.26 |
| East Midlands | p75 | 1 | 1 | +65.60 |
| East Midlands | p75 | 1 | 2 | -224.40 |
| East Midlands | p75 | 2 | 1 | +1,171.58 |
| East Midlands | p75 | 2 | 2 | +881.58 |
| West Midlands | median | 1 | 1 | -285.30 |
| West Midlands | median | 1 | 2 | -580.30 |
| West Midlands | median | 2 | 1 | +425.43 |
| West Midlands | median | 2 | 2 | +130.43 |
| West Midlands | p25 | 1 | 1 | -599.80 |
| West Midlands | p25 | 1 | 2 | -894.80 |
| West Midlands | p25 | 2 | 1 | -203.56 |
| West Midlands | p25 | 2 | 2 | -498.56 |
| West Midlands | p75 | 1 | 1 | -21.12 |
| West Midlands | p75 | 1 | 2 | -316.12 |
| West Midlands | p75 | 2 | 1 | +953.81 |
| West Midlands | p75 | 2 | 2 | +658.81 |
| East of England | median | 1 | 1 | -215.88 |
| East of England | median | 1 | 2 | -433.88 |
| East of England | median | 2 | 1 | +381.92 |
| East of England | median | 2 | 2 | +163.92 |
| East of England | p25 | 1 | 1 | -481.70 |
| East of England | p25 | 1 | 2 | -699.70 |
| East of England | p25 | 2 | 1 | -149.73 |
| East of England | p25 | 2 | 2 | -367.73 |
| East of England | p75 | 1 | 1 | +71.28 |
| East of England | p75 | 1 | 2 | -146.72 |
| East of England | p75 | 2 | 1 | +956.22 |
| East of England | p75 | 2 | 2 | +738.22 |
| South East | median | 1 | 1 | -135.61 |
| South East | median | 1 | 2 | -322.61 |
| South East | median | 2 | 1 | +433.48 |
| South East | median | 2 | 2 | +246.48 |
| South East | p25 | 1 | 1 | -392.38 |
| South East | p25 | 1 | 2 | -579.38 |
| South East | p25 | 2 | 1 | -80.07 |
| South East | p25 | 2 | 2 | -267.07 |
| South East | p75 | 1 | 1 | +103.34 |
| South East | p75 | 1 | 2 | -83.66 |
| South East | p75 | 2 | 1 | +911.38 |
| South East | p75 | 2 | 2 | +724.38 |
| South West | median | 1 | 1 | -157.54 |
| South West | median | 1 | 2 | -393.54 |
| South West | median | 2 | 1 | +558.50 |
| South West | median | 2 | 2 | +322.50 |
| South West | p25 | 1 | 1 | -499.50 |
| South West | p25 | 1 | 2 | -735.50 |
| South West | p25 | 2 | 1 | -125.41 |
| South West | p25 | 2 | 2 | -361.41 |
| South West | p75 | 1 | 1 | +165.43 |
| South West | p75 | 1 | 2 | -70.57 |
| South West | p75 | 2 | 1 | +1,204.44 |
| South West | p75 | 2 | 2 | +968.44 |
Hypothetical two-adult household; April 2025 workplace-job pay and PIPR modelled rental-stock inputs; England 2025/26 income tax and employee NI; hypothetical Band D council tax; PIPR release vintage 16 September 2026; £ per month; remainder after specified tax, NI, rent and council tax, before commuting. Sources: ONS ASHE Table 7 (2025 provisional), ONS PIPR (16 September 2026), HMRC 2025/26, MHCLG 2025/26; Indiconomics scenario calculation.