What the customer-service tenure decline can tell us
Four US January snapshots, 2020–2026
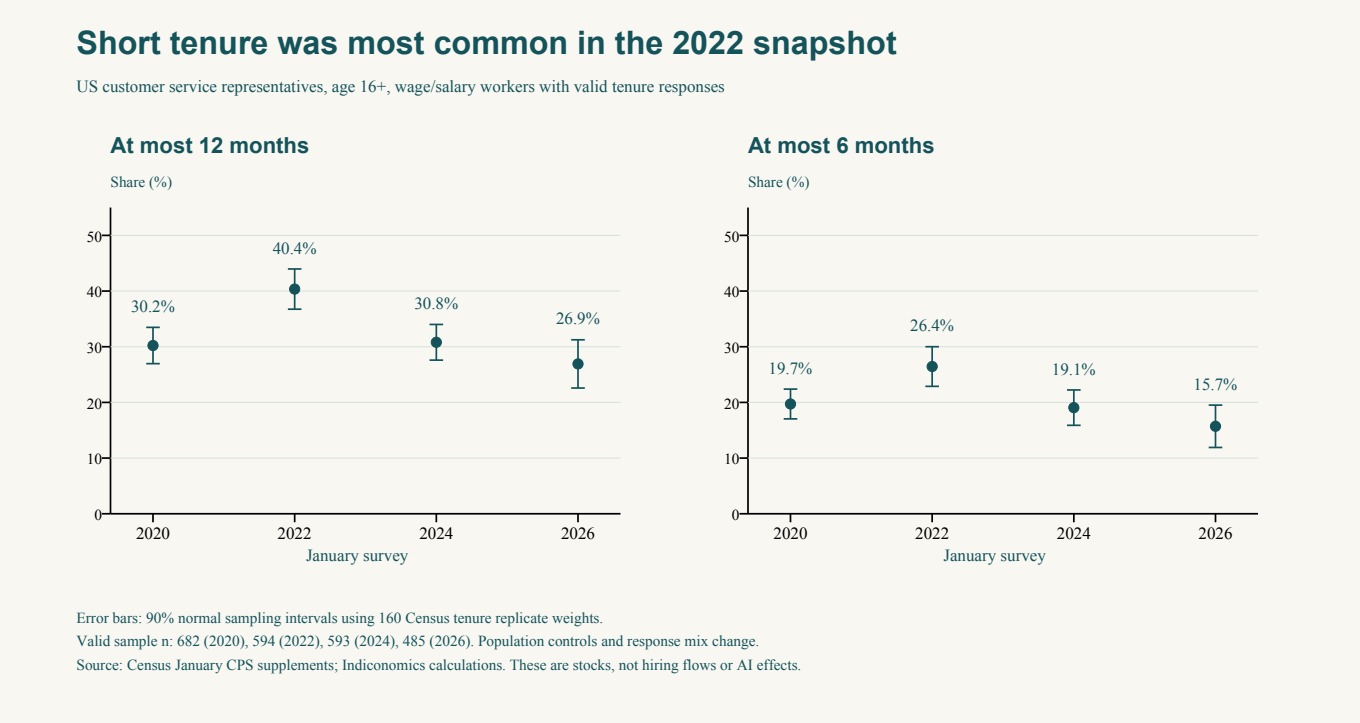
In January 2022, an estimated 40.4% of employed US wage and salary customer service representatives with usable tenure responses had coded tenure of at most a year with their current employer. Four years later, the share was 26.9%. That fall may look like a loss of first jobs. But employer tenure is not time in an occupation, and January 2022 is a consequential starting point.
In January 2020, the same estimated share was 30.2%. By January 2024 it was 30.8%. The four observations rise, then fall: 30.2%, 40.4%, 30.8%, 26.9%. Most of the difference between the 2022 and 2026 survey estimates was already visible in 2024. Yet the 2020–2026 difference is much smaller and too imprecise to establish a lasting decline from the earlier baseline. Neither result tells us how many people got their first customer-service job.
Scroll the figure sideways to read its labels.
This is an occupation-level reconstruction of a public survey measure, not a report from employers about vacancies. The Current Population Survey tenure supplement asks employed respondents how long they have worked for their present employer. Someone who spent ten years in a call centre and changed firms last spring can appear in the short-tenure group. A new entrant who left the occupation before the January interview cannot. A long-tenured worker whose tasks changed without an employer change also stays outside the short-tenure group. The denominator is people still employed in this occupation, in wage and salary jobs, who gave a usable tenure response. It is not everyone who applied, was hired, received training or lost a job.
The resulting share reflects several flows at once. It could fall because of fewer hires, weaker job switching, stronger retention among established employees, exits of recent hires, or a changed mix of respondents. The four snapshots cannot separate those flows.
The high starting point
The twelve-month share rose by 10.1 percentage points between January 2020 and January 2022. It then fell by 9.6 points by January 2024. The latter difference has an approximate 90% sampling interval of −16.4 to −2.7 points under the conservative cross-year covariance bound used here. The 2024–2026 difference was another −3.9 points, but its interval, −11.4 to +3.7 points, is too wide to say much about that leg on its own. Four January observations cannot locate a turning month inside either two-year gap.
Against January 2020, the 2024 estimate is only 0.6 point higher. The 2026 estimate is 3.3 points lower, with an interval of −10.9 to +4.3 points. That interval does not prove the underlying rates were equal. It means these data do not establish a sustained 2020–2026 decline. This baseline comparison was added by independent review after the four estimates were visible; it is a countercheck, not a prospective test whose threshold was fixed in advance.
The six-month measure tells a similar broad story. It was 19.7% in 2020, 26.4% in 2022, 19.1% in 2024 and 15.7% in 2026. Estimates change when a strict rather than inclusive tenure cutoff is used, especially around rounded month and year responses. The rise and fall survives those checks, though none turns employer tenure into a first-job rate.
A plausible rival account starts with 2022 rather than with artificial intelligence. That snapshot may reflect a period of unusually frequent job changes, followed by normalization of turnover or a different balance of hiring and retention. The data here cannot identify which of those mechanisms dominates. Nor can they rule out AI as one influence. They do show why a story built entirely on the 2022–2026 endpoints risks turning a high starting observation into a dated technology event.
Does age explain the drop?
If the occupation’s workforce simply became older, fewer workers might appear in the short-tenure group even if behavior within each age group stayed the same. We tested that accounting explanation by dividing respondents into five age bands: 16–21, 22–25, 26–34, 35–49 and 50 or older. A symmetric decomposition assigns changes in the groups’ shares to an age-composition term and changes in each group’s short-tenure rate to a within-group term.
For the 13.4-point fall from January 2022 to January 2026, changing shares across those bands account for about −1.0 point; changes within the bands account for about −12.4 points. Combining the bands into three broader groups yields −0.5 and −13.0 points. The shift between these particular age groups is therefore a small part of the point estimate. The component estimates also have sampling uncertainty, assessed with a first-order approximation described in the methods.
The larger within-band term does not mean twelve points were caused by AI, or even by fewer hires. Workers of the same broad age can have different work histories, and the people interviewed are different across years. Education, employer mix, job switching, retention and response selection can all change within a band. The smallest five-band cell has only 45 respondents, so individual young-group estimates are a poor basis for a standalone entrant claim.
The survey also changes at the edges. The basic-survey-weighted share of eligible customer-service respondents outside the usable-tenure sample was 19.9% in 2020, 21.5% in 2022, 17.8% in 2024 and 12.1% in 2026. Those records are outside the main tenure ratios. Changing response mix is not repaired by a narrow sampling interval. Population controls changed, and January 2026 fell during a CPS sample redesign. Those facts need not erase the measured pattern, but they prevent us from treating four weighted estimates as a perfectly fixed population series.
What would answer the first-rung question?
The concern behind this investigation is concrete. If employers need fewer novice workers, people seeking a first customer-service job face a changed route into the occupation, and firms may later have fewer experienced staff to promote. Yet a short-tenure stock alone cannot show that route narrowing. It mixes first entrants with experienced switchers and misses applicants and former workers.
Nor is the “before total employment” part measured here. We can calculate basic-weight occupation stock estimates as a diagnostic, but have not established a suitable uncertainty method for a comparable detailed-occupation total. A different survey’s payroll total cannot fill that gap by supplying a timestamp for these tenure estimates. The missing tests are specific: valid new-hire or occupation-entry flows with observed transitions, linked task and training changes in the same population, and a defensible occupation-stock comparison if timing relative to total employment is claimed.
The decisive observation lies outside this survey denominator: who tried to enter customer service, who was hired, and whether those chances changed before comparable occupation employment did. A high January 2022 tenure share can start that investigation. It cannot tell us when, or whether, AI closed the first rung.
Methods and measurement boundaries
The analysis is descriptive and uses four January repeated cross-sections of the US Current Population Survey (CPS) employee-tenure supplement: 2020, 2022, 2024 and 2026.
Population, codes and joins
Select civilian persons (PRPERTYP=2) aged at least 16, employed (PEMLR 1 or 2), in wage/salary classes PEIO1COW 1–5, whose current primary-job detailed occupation is Census 5240, customer service representatives (SOC 43-4051). Primarily technical-support occupations such as Census 1050 are excluded. The 2020 primary-job occupation field is PEIO1OCD; subsequent files use PTIO1OCD. The field-name change follows the March 2021 CPS prefix change documented in the Census Basic Monthly footnotes, not a change in the selected occupation. In all four years the same 5240 occupation definition is checked against official year-specific occupation layouts.
For each year retain a usable tenure interview (PRTENSAT=2, PWTENWGT>0, PTST1TN>=0). This yields unweighted n=682, 594, 593, 485 for 2020, 2022, 2024 and 2026, from eligible counts 852, 746, 720, 554. Use PWTENWGT/10000 for every conditional tenure ratio. The within-year supplement-to-tenure-replicate join is on both QSTNUM and OCCURNUM, one to one. Every selected record links; the full replicate repwgt0 equals PWTENWGT for every selected record. No person is linked across years. For 2020 and 2024, basic weights come from the basic portion of the supplement file, not a separate basic-file join. The accepted earlier review checked the 2022/2026 supplement-to-basic target fields and weights.
PTST1TN is a two-implied-decimal recode of current-employer tenure in years. The primary indicators are PTST1TN<=100 (coded at most 12 months) and <=50 (coded at most six months). Strict <100 and <50 are reported separately. The inclusive one-year bucket is not a verified date of hire: respondents can give rounded years, and exact-month follow-ups may be missing. Records with PTST1TN=100, PTST1A=1, PEST1B=4, and missing PEST3 are explicitly tested by assigning the boundary-unknown indicator outside the numerator; there are 1, 3, 1 and 2 such records by year. This is a boundary sensitivity, not an allocation correction or evidence that these workers truly exceeded 12 months. The age/occupation-unallocated sensitivity excludes records with nonzero PXAGE or PXIO1OCD; it does not remove every tenure imputation or solve selection into the interview.
Estimates and uncertainty
Each share is the supplement-weighted indicator total divided by the supplement-weighted valid-tenure denominator. Numerator and denominator are recalculated under all 160 official tenure replicate weights. For a ratio estimate θ, the variance is (4/160) × Σ(θ_r − θ_full)^2, following the Census person-level replicate instructions. Pointwise 90% normal sampling intervals are θ ± 1.645 × SE. They do not provide simultaneous coverage for the many reported estimates and contrasts, and they do not bound systematic nonresponse, measurement or control changes.
| January | Coded ≤12 months, % (pointwise 90% interval) | Coded ≤6 months, % (pointwise 90% interval) |
|---|---|---|
| 2020 | 30.22 (26.96, 33.48) | 19.72 (17.04, 22.39) |
| 2022 | 40.35 (36.74, 43.97) | 26.44 (22.89, 30.00) |
| 2024 | 30.80 (27.59, 34.00) | 19.06 (15.88, 22.24) |
| 2026 | 26.91 (22.58, 31.25) | 15.71 (11.91, 19.51) |
The extension design specified the following contrasts after the 2022/2026 estimates were known but before the new 2020/2024 estimates were read: 2020–2022, 2022–2024, 2024–2026 and 2022–2026. For the twelve-month measure their differences in percentage points are +10.14, −9.56, −3.88 and −13.44. The conservative sampling-covariance-bound 90% intervals are respectively [+3.27, +17.01], [−16.37, −2.74], [−11.42, +3.65] and [−21.39, −5.50]. The baseline counterchecks 2020–2024 and 2020–2026 were added by the independent reviewer after viewing all four estimates. Their twelve-month differences are +0.58 [−5.88, +7.04] and −3.31 [−10.90, +4.29]. These intervals do not make imprecise differences proof of equality.
The year-to-year sampling covariance is not identified by same-numbered replicate labels from different years. The producer reports sqrt(SE_a²+SE_b²) under an explicit cross-year independence assumption and a Cauchy–Schwarz upper-SE sensitivity SE_a+SE_b, used for the main prose intervals. Replicates are never paired across years as common sampling units. These bounds address sampling covariance only. Four January points cannot locate within-gap peaks or establish a dated event.
Age accounting and diagnostic totals
The primary bands were fixed for the extension after the 2022/2026 estimates were known and before inspecting the new 2020/2024 estimates. They are 16–21, 22–25, 26–34, 35–49 and 50+. The broader fixed sensitivity is 16–25, 26–49 and 50+. For each year and band, w is that band's valid-tenure supplement-weighted share and p is its coded ≤12-month rate. For a start year 0 and end year 1, the symmetric components are Σ[(w₁−w₀)(p₁+p₀)/2] for between-band composition and Σ[(p₁−p₀)(w₁+w₀)/2] for within-band rates. Their sum exactly equals the total rate difference. For 2022–2026 the five-band components are −1.03 and −12.41 percentage points, summing to −13.44; the three-band values are −0.46 and −12.98. The five-band first-order covariance-bound 90% intervals are [−4.29, +2.23] and [−19.47, −5.35] points. Each year is perturbed separately with its own replicates while the other year's full estimate is held fixed; combining the two variances assumes independence, and adding component SEs is a first-order covariance sensitivity. This is not exact nonlinear finite-sample coverage. Empty cell denominators are missing, never zero, though all reported cells had positive denominators. The smallest raw primary cell has 45 observations. Age is not experience or first-entry status. The within-band component retains finer age composition, other characteristics and response changes; it is not a covariate-adjusted causal effect.
PWCMPWGT/10000 produces all-eligible occupation-stock diagnostic point estimates of about 2.493m, 2.560m, 2.737m and 2.328m. The valid-tenure PWTENWGT/10000 denominators are different: about 2.443m, 2.497m, 2.692m and 2.411m. The detailed-occupation basic-stock standard-error route is unresolved. No tenure replicate SE is attached to a basic-stock point, and no claim is made that occupation-wide employment was unchanged or that tenure changed before total employment. The basic-weight share outside the usable-tenure domain is 19.89%, 21.49%, 17.83% and 12.07%; zero supplement weights and nonresponse need not be random.
Comparability and remaining test
Yearly population controls are not held constant. Census records a reissue of the January 2026 basic file using updated controls; the 2026 survey occurred during the 2025–2026 sample-redesign phase-in. BLS experimental control adjustments are for broader series and cannot be transplanted into this occupation-specific tenure ratio. Supplement sample and valid-response composition change across years. An interval based on replicate weights does not repair these sources of error. This bounded descriptive result does not observe gross hires, occupation-first entrants, applications, exits, employer AI exposure, tasks or training. A stronger entry-flow or causal sequence requires validated person/employer transitions and, for “before totals,” a comparable occupation-stock variance route. Original task/training evidence from other workplaces cannot be treated as a linked US customer-service ladder.
References and source versions
- US Census Bureau, Current Population Survey: January 2020 Technical Documentation, official PDF, PDF pp. 129–130 (tenure questions) and p. 136 (recode and weight); 2020 Basic CPS layout for occupation code 5240; January supplement CSV; tenure replicate file.
- US Census Bureau, Current Population Survey: January 2022 Technical Documentation, official PDF; January supplement CSV; tenure replicate CSV.
- US Census Bureau, Current Population Survey: January 2024 Technical Documentation, official PDF, Attachment 7 (tenure questions and recodes), Attachment 16 (replicate instructions) and p. 266 (comparison limits); January supplement CSV; tenure replicate CSV.
- US Census Bureau, Current Population Survey: January 2026 Technical Documentation, official PDF; January supplement CSV; tenure replicate CSV.
- US Census Bureau, CPS Basic Monthly Footnotes, item 16 on the March 2021
PE/PRtoPTprefix transition and item 26 on the January 2026 basic-file reissue. - US Census Bureau, Instructions for CPS Person-Level Replicate Weights (2012), 160-replicate SDR/Fay variance instructions used for supplement-weighted ratios.
- US Bureau of Labor Statistics, Current Population Survey Sample Redesign (2025 notice) and Experimental series accounting for January 2026 population-control effects (2026). The source session used web-tool page content after direct requests returned HTTP 403. These notices do not supply an adjustment for this detailed occupation/tenure series.